Case Study
Designing a scalable performance reporting system that increased assessments by 24%

Product Context
Turning Complex Performance Data Into Actionable Insight
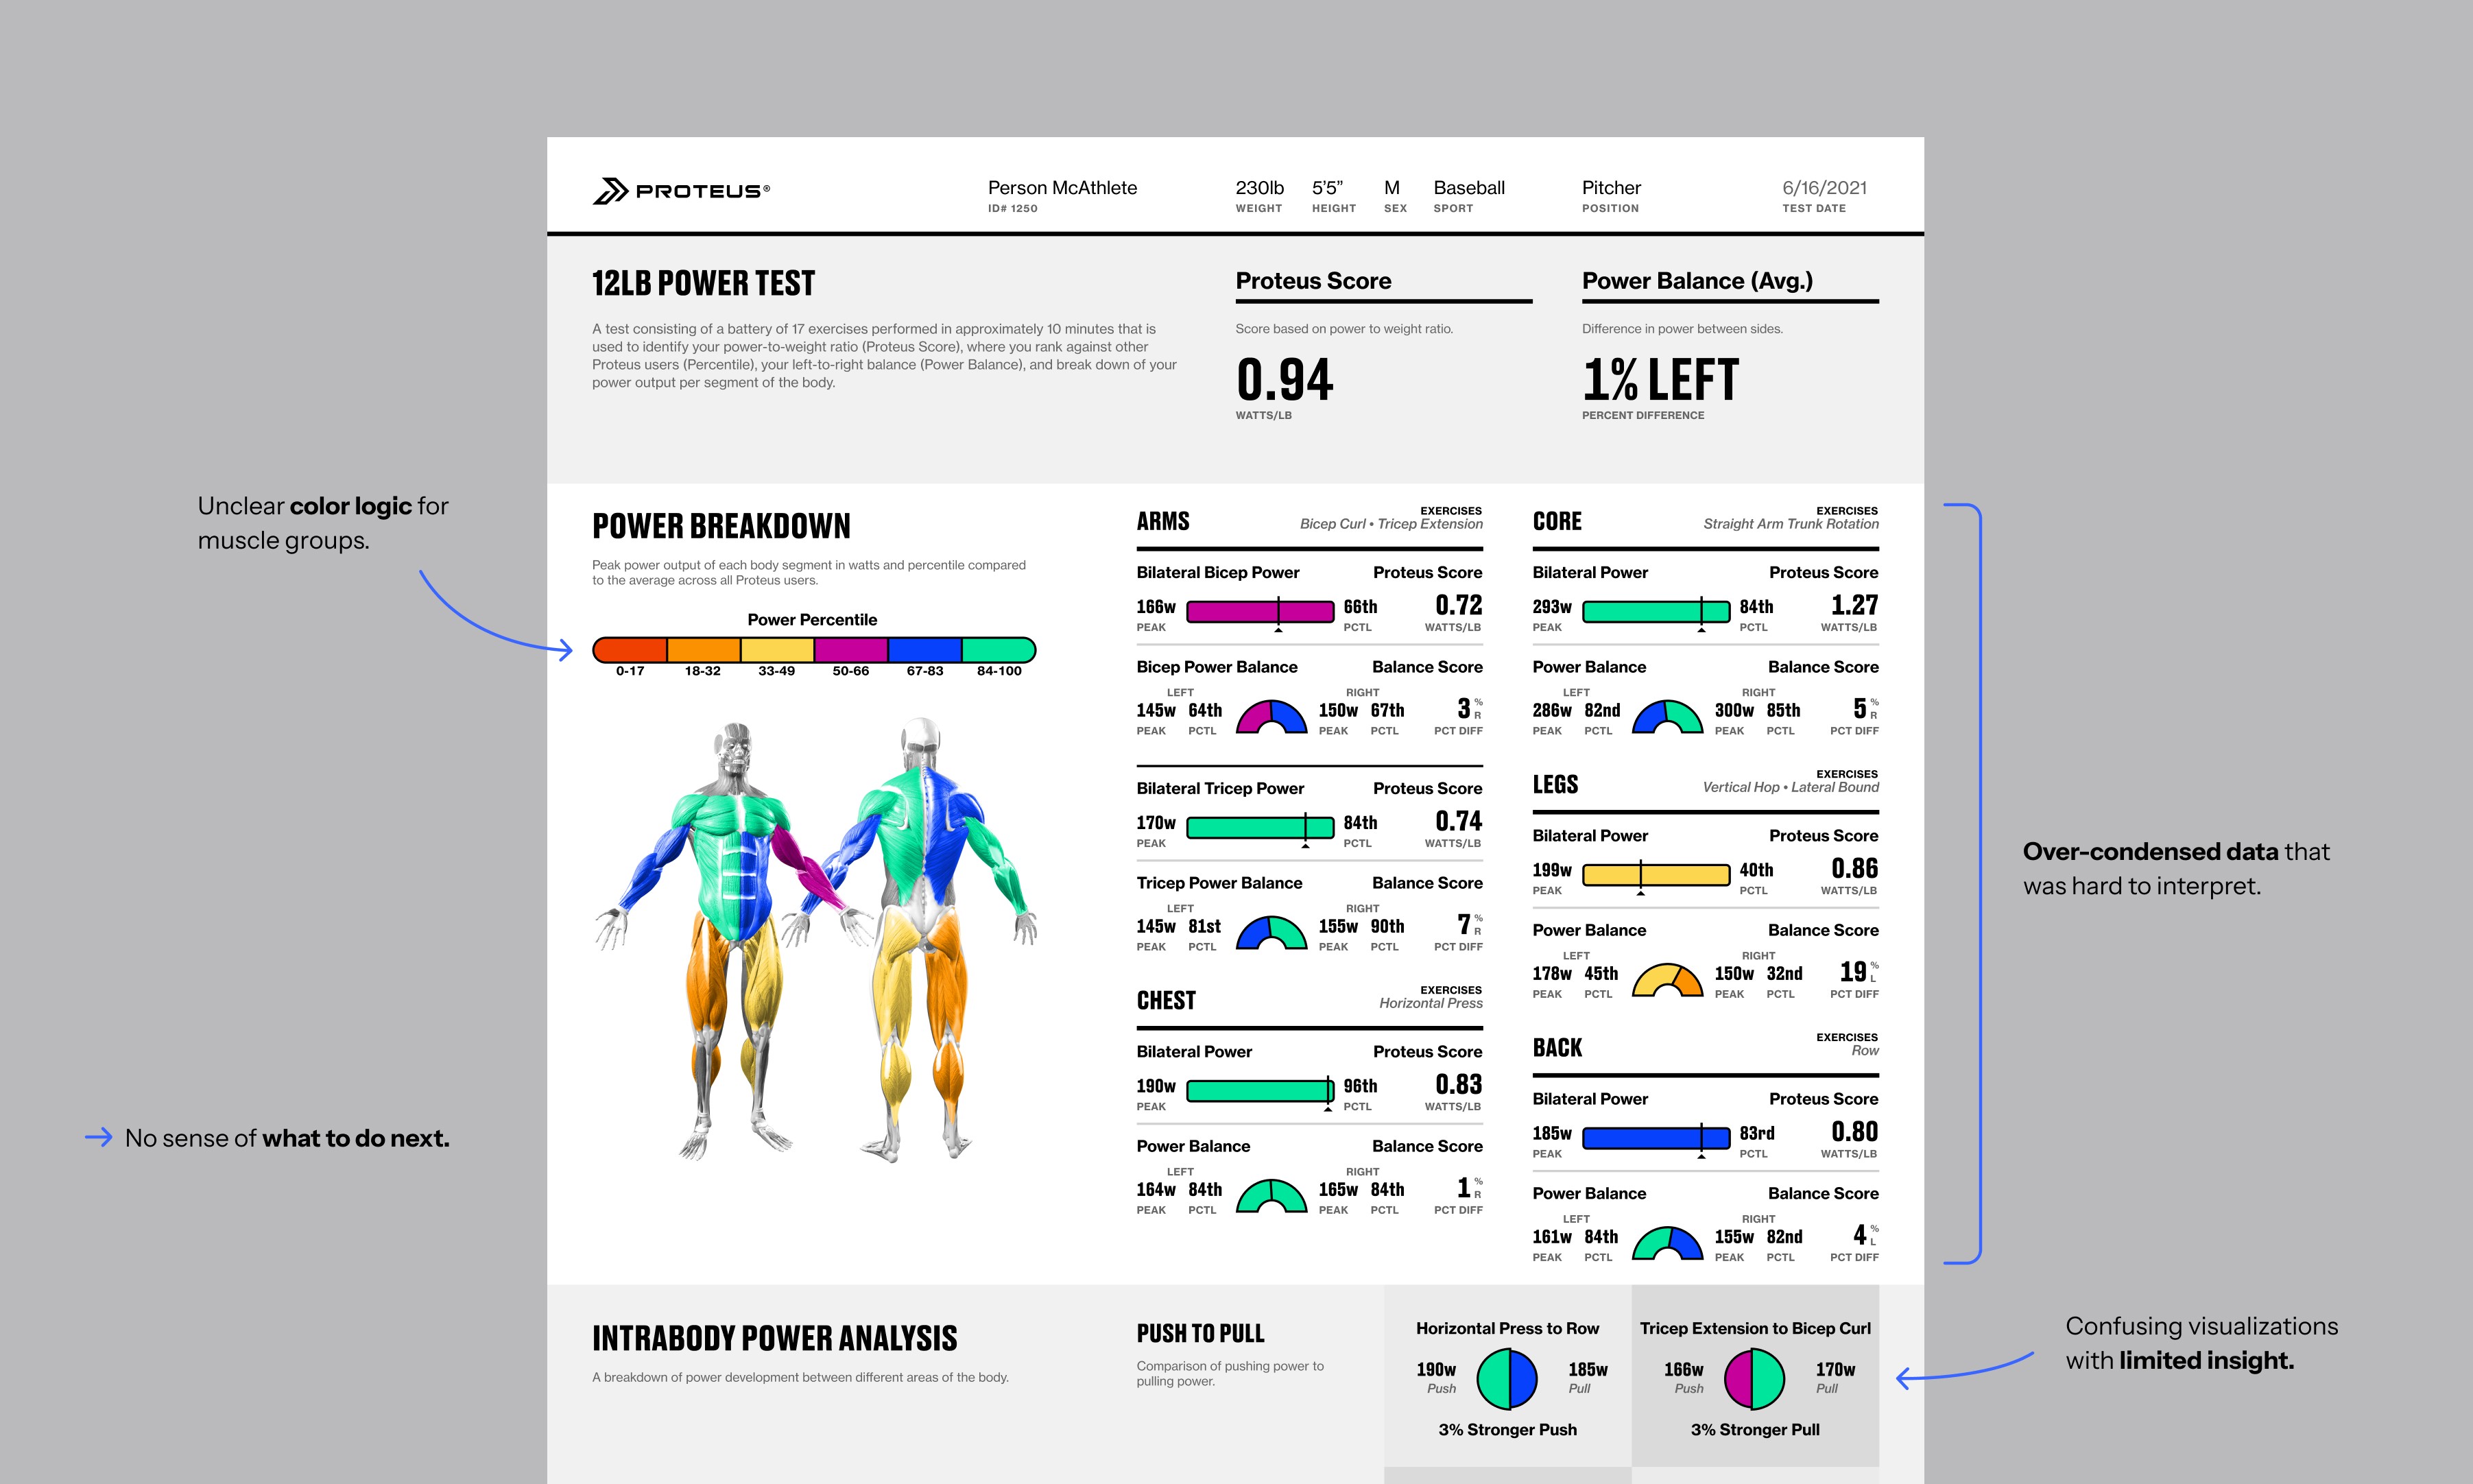
Proteus Motion builds a 3D resistance training system that captures detailed biomechanical data across any human movement. Trainers use it inside sports performance and rehabilitation facilities to test athletes and guide programming decisions. Each assessment produced rich performance data, but the reporting experience made it difficult to understand what the results meant or how to act on them. Information was delivered through a dense PDF that didn’t reflect how trainers actually review performance in real training environments. The opportunity was to redesign reporting so results could be understood quickly, compared over time, and translated directly into training decisions.
Platforms
Android Kiosk · Web App · Responsive Mobile
Team
Product, Engineering, Data Science (Series A Startup)
Duration
6 months
Impact
Increasing Testing Adoption Across Facilities
Following launch, assessment activity increased across facilities and reinforced a reporting approach centered on clarity and actionable guidance.
0%
0%
Increase in assessments across facilities
0%
0%
Increase in assessments at high-adoption sites
0%
0%
Increase in trainers regularly using the feature
Role
End-to-End Product Design
Co-led research and defined the information architecture, visualization system, and multi-platform UX. Partnered closely with engineering and data science to design scalable data states and edge-case handling.
Challenge
High Data Fidelity, Low Interpretability
Proteus generated sophisticated performance metrics, but the interface did not support how trainers naturally review results.
Trainers needed to scan high-level summaries quickly, identify imbalances, and move into programming decisions. Athletes needed to understand strengths and weaknesses without being overwhelmed by technical detail.
The redesign needed to balance clarity with depth—making complex data understandable without stripping away meaningful insight.
Research & Structure
Designing Around Real Training Workflows
Through moderated sessions with active trainers, we observed a consistent review pattern: first understand the results, then interpret patterns, then adjust training.
Two prototype directions tested different approaches. One emphasized speed and scanning. The other supported deeper comparison and trend analysis.
The final structure combined both into a modular, tab-based layout that supports quick interpretation at the top level and deeper exploration when needed.

Information Design
Translating Complex Metrics into Clear Decision Signals
Proteus metrics are multi-variable and technical. The challenge was helping users recognize patterns without requiring them to interpret raw data.
The primary fan chart visualizes movement categories across power and acceleration, making performance patterns visible at a glance. Supporting percentile views and cohort comparisons provide additional context across sessions and peer groups.
Edge cases—including partial assessments, small cohort samples, and low-confidence states—were handled carefully to preserve clarity and trust.


Workflow
From Understanding to Action
The redesigned experience supports a clear progression:
Results present performance summaries and trendlines.
Insights clarify strengths, imbalances, and comparative positioning.
Recommendations guide actionable next steps.
By aligning structure with real coaching behavior, reporting shifted from static output to an integrated performance tool.


Multi-Platform
Extending Guidance Beyond the Facility
The experience was designed across kiosk, web, and mobile to support continuity between in-facility testing and off-site review. Athletes can access shared recommendations independently, while trainers maintain a consistent workflow across devices.

Outcomes
Improved Adoption Through Structural Clarity
The redesigned reporting experience made complex data easier to interpret and act on. By aligning the structure with real training workflows, the platform became more central to programming decisions and better positioned to scale as new features were introduced.